

If your computer crashes or freezes a lot, or it turns itself off all of a sudden, or your games won’t launch out of nowhere, and you have no idea what’s going on, don’t worry, there are usually crash logs and reports saved in your computer that can help you identify the culprit, or at least get closer to the root cause. Here in this post, we’ll introduce 4 kinds of crash logs on Windows and how you can use them to identify the culprit to your computer software problems.
4 Kinds of Crash Logs on Windows
The following are 4 types of crash logs that you can find on Windows. You can check them all if necessary, and cross-check the information in these 4 tools to dig out the culprit, and eventually, solve the computer performance and reliability issues by yourself.
- View Crash Logs with PowerShell
- View Crash Logs with Event Viewer
- View Crash Logs with Reliability Monitor
- View Crash Logs with Minidump Files
1. View Crash Logs with PowerShell
To view Windows crash logs with PowerShell, here’s what you can do:
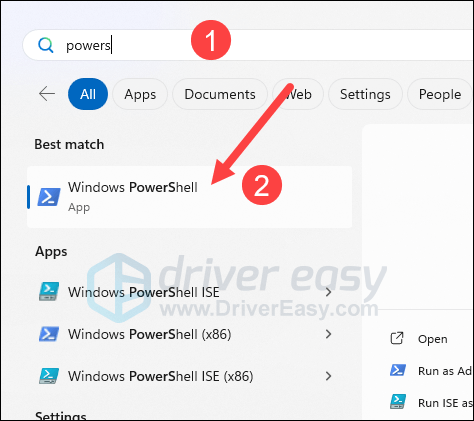
- On your keyboard, press the Windows key and type PowerShell, then select Windows PowerShell.
- Copy and paste this command
Get-EventLog -LogName System -Newest 15 -EntryType Errorto the PowerShell window and hit Enter.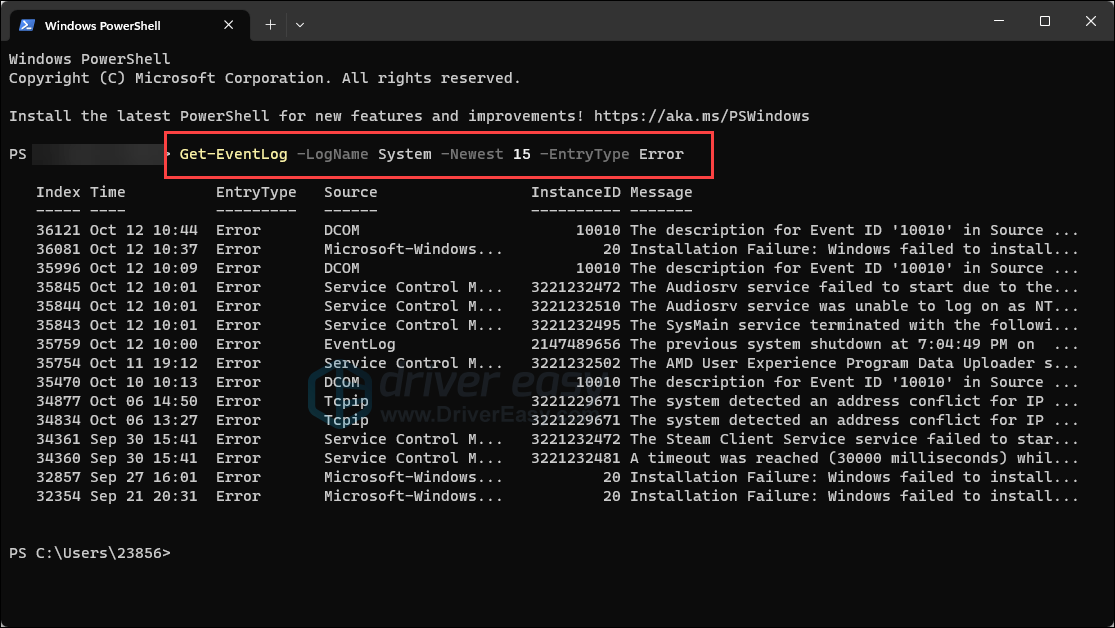
- The latest 15 error entries will be listed for you to see. If you want to see more latest entries, just change the number 15 to whatever number you desire.
Note that this command only displays very basic information about the computer system issues, so if this is not detailed enough for you, please move on.
2. View Crash Logs with Event Viewer
Event Viewer keeps a detailed and chronological record of system, security, and application notifications, so it’s a good tool to narrow down any system problems and failures. To use Event Viewer:
2.1 Check Windows System Logs in Event Viewer
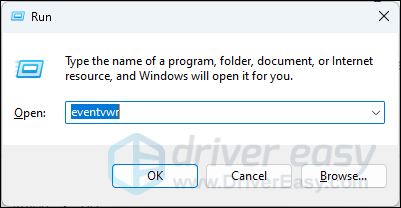
- On your keyboard, press the Windows key and the R key at the same time. Type eventvwr and hit Enter.
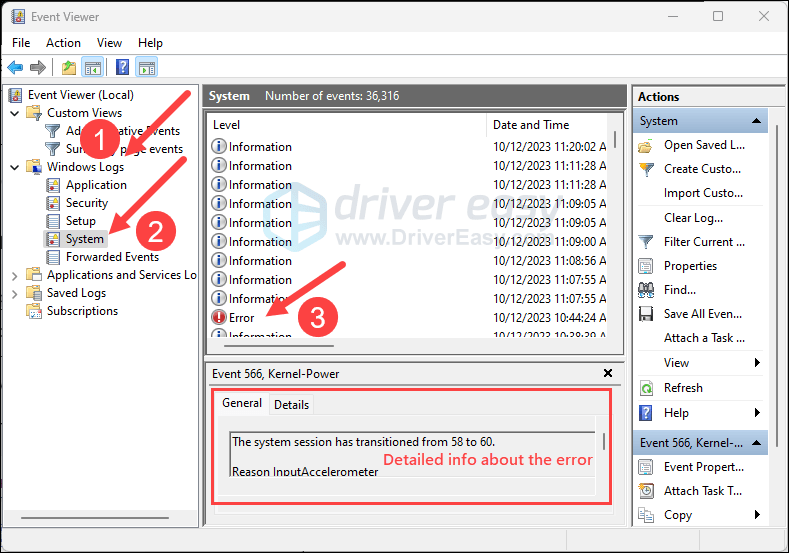
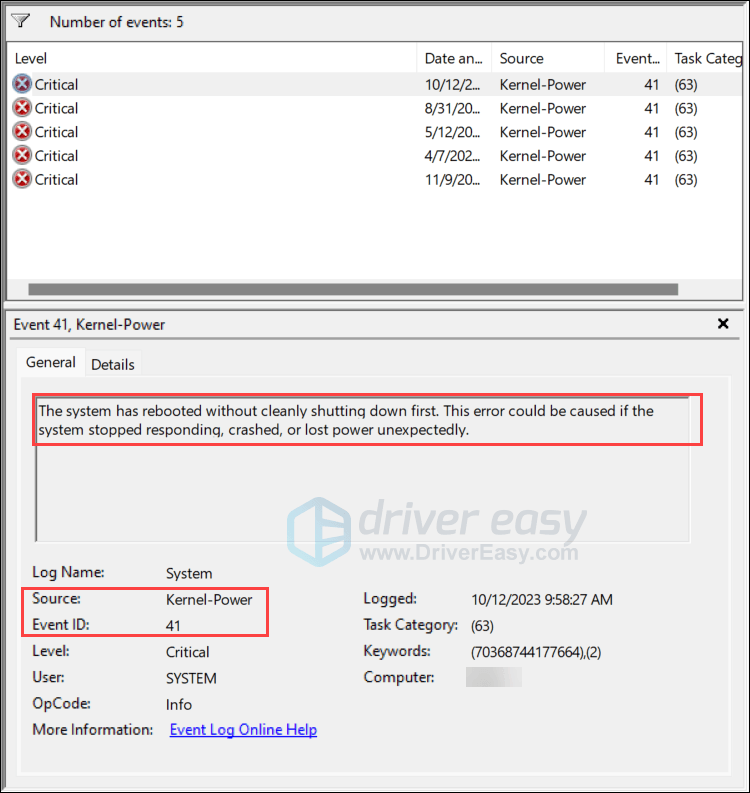
- Click Windows Logs, then System, and scroll down on the right panel to click the red exclamation entry you see, and you’ll find detailed information about this error underneath.
Most of the entries you see in Event Viewer are tagged with:
- Information (a white i mark),
- Warning (a yellow exclamation mark),
- Error (a red exclamation mark), or
- Critical (a red cross)
We suggest that you focus on the entries with a red cross only, i.e. the critical events, since Event Viewer can be a bit too sensitive when it comes to crash logs: most of the time, Warning and Error entries (yellow and red exclamations) merely mean something unexpected happened or didn’t happen. While the Information entries are just there to record events in Windows, purely informational.
So you can also choose to view the crash logs with only the Critical entries shown in the way follows.
2.2 Check Critical events only in Event Viewer
- On your keyboard, press the Windows key and the R key at the same time. Type eventvwr and hit Enter.
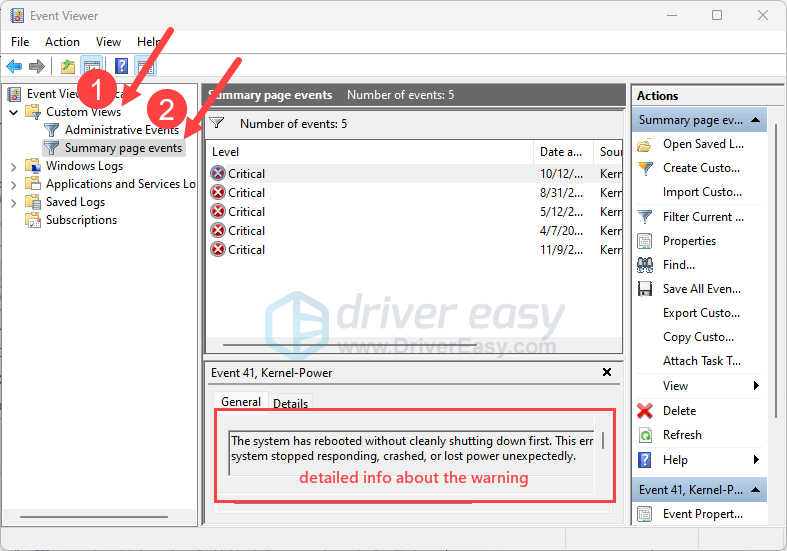
- On the left panel, click Custom Views, then Summary page events, then you should see only the critical errors listed, with the detailed information listed underneath.
2.3 How to use the information in Event Viewer
In the detailed information section, you can refer to the information mentioned in the General section, which may be helpful sometimes. You can also check the Source and Event ID fields. For instance, mine is showing “Kernel-Power 41”, and if I do a Google search with this keyword combination, I’ll get a lot of results, with many of them mentioning power-related problems. Then I’ll know what to look at to fix this computer problem.
If there’s not much useful information that can be seen on your Event Viewer, you can move on to use the next tool.
3. View Crash Logs with Reliability Monitor
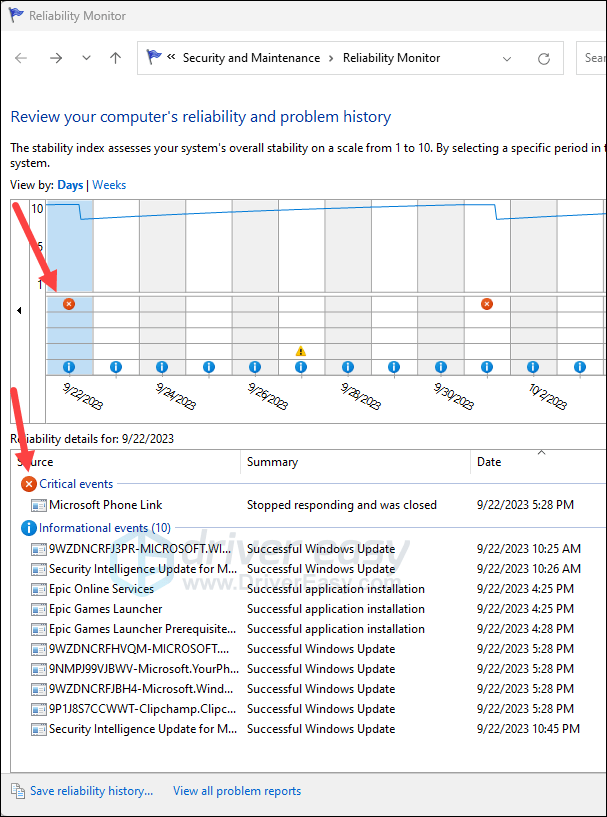
Reliability Monitor shows your Windows 10 system stability history at a glance. It also tracks critical events, warnings, and informational events on your computer. To use Reliability Monitor:
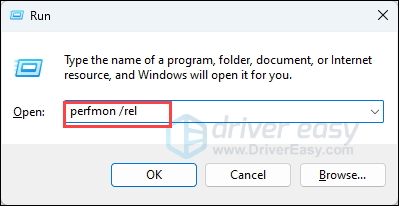
- On your keyboard, press the Windows key and the R key at the same time. Type perfmon /rel and hit Enter.
- Then you should see a window like this. Click the section where there’s a red cross (meaning critical events), and you should see the detailed information about this event.
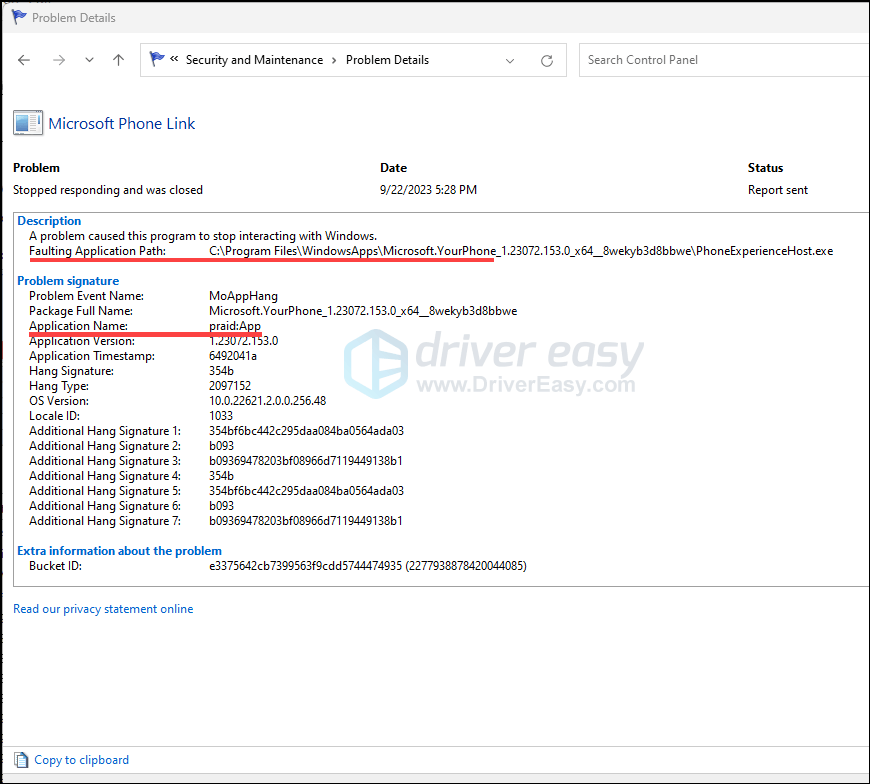
- Double-clicking each event to see more detailed information in a new window.
3.1 How to use Reliability Monitor
If you see a faulting application name and a faulting module path in the detailed information window, you can do a Google search with their combination and find the results that you need.
For instance, I see a LinkCollector.exe as the faulting application and KERNELBASE.dll as the faulting module. To “translate” the crash log, it’s saying KERNELBASE.DLL has trouble launching LinkCollector, the bookmark manager.
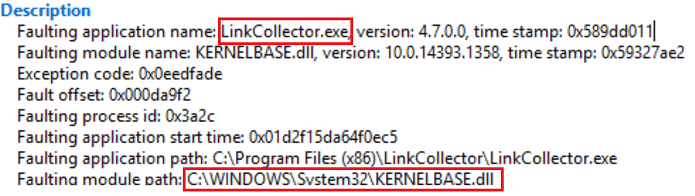
Then I did a Google search on LinkCollector and KERNELBASE.dll individually, and almost all results told me that the latter is a legitimate Windows file that can’t be removed from my computer. I then looked at the bookmark manager, and it turned out that this software is rather old, and probably has a problem keeping up with Windows 11 or Windows 10. For older software to work smoothly on newer operating systems, running it in compatibility mode should be the go-to option. So the problem was fixed.
4. View Crash Logs with Minidump Files
Minidump files are very useful if you’re experiencing blue screen of death errors. When a fatal system error or system crash occurs, a minidump file will be saved on your computer. With the information stored in these minidump files, it’s much easier and faster to locate the culprit to your blue screen of death errors.
The minidump files are usually saved in C:\Windows\Minidump, but if you don’t see it there, please make sure that you have the minidump file feature enabled.
4.1 To enable the Minidump File
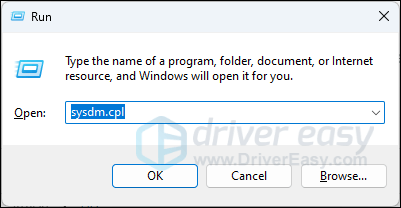
- On your keyboard, press the Windows key and the R key at the same time. Type sysdm.cpl and hit Enter.
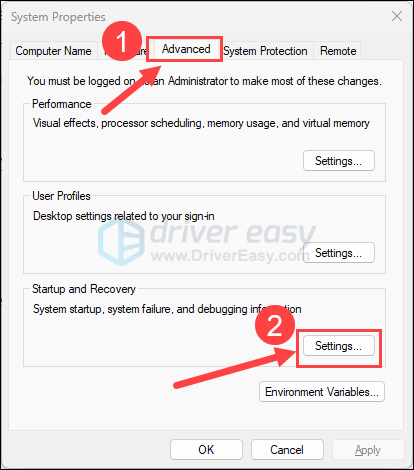
- Click Advanced, then click the Settings button under Startup and Recovery.
- Make sure the boxes for Write an event to the system log and Automatically restart are checked, and the Write debugging information has Small memory dump (256 KB) selected.
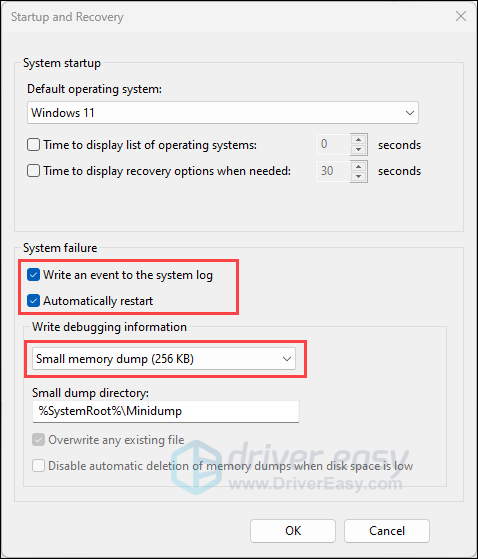
- Click OK to save the changes.
4.2 How to use Minidump Files to Fix Blue Screen of Death Errors
- Firstly, you need to download and install WinDbg from here: https://apps.microsoft.com/detail/9PGJGD53TN86?hl=en-us&gl=US
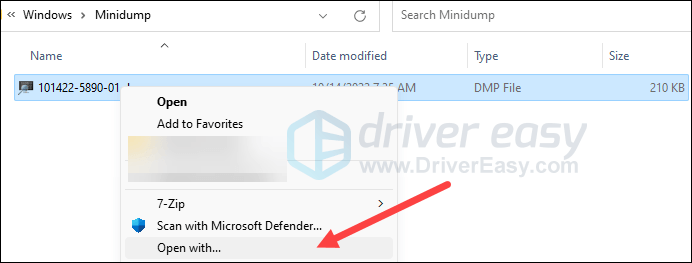
- Go to C:\Windows\Minidump (where your minidump files are saved), then right-click one of the minidump files and select Open with…
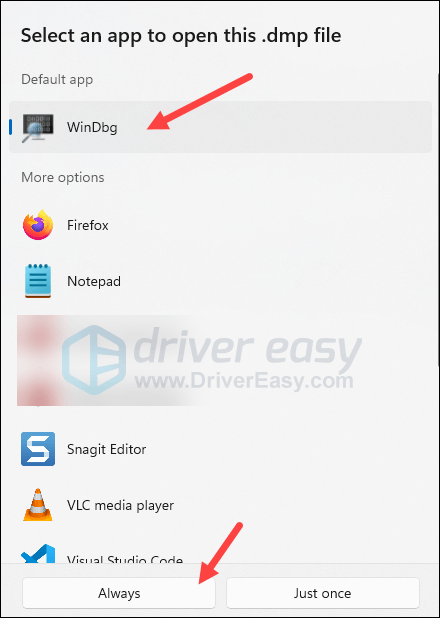
- Select WinDbg, and select Always, so WinDbg will be the default app to open all the rest of your minidump files.
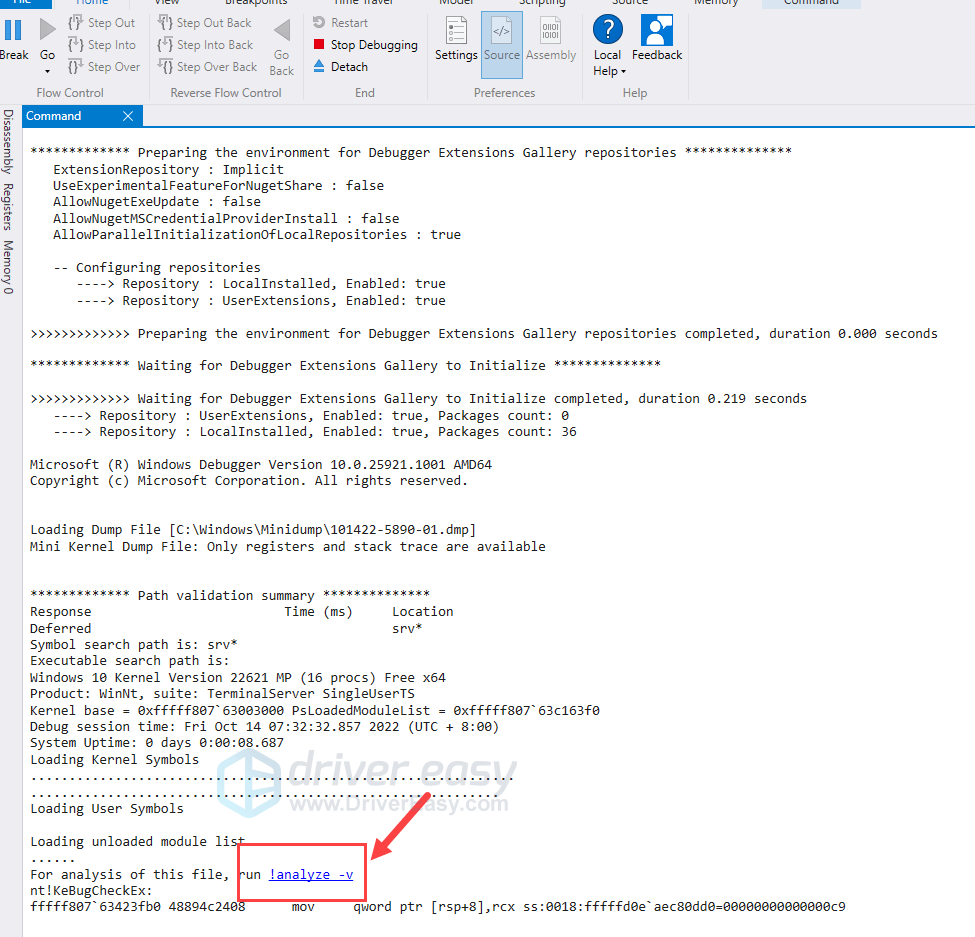
- Then the minidump file will open.
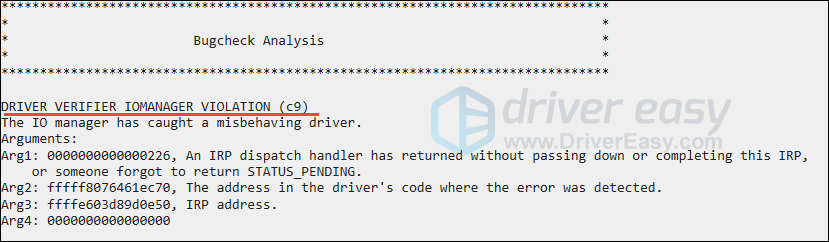
- When it finishes loading, you’ll see a window like this. Click the !analyze -v section to continue.
- When you see a window like this, and with no *BUSY* wording in the kd> field, the debugging is done.
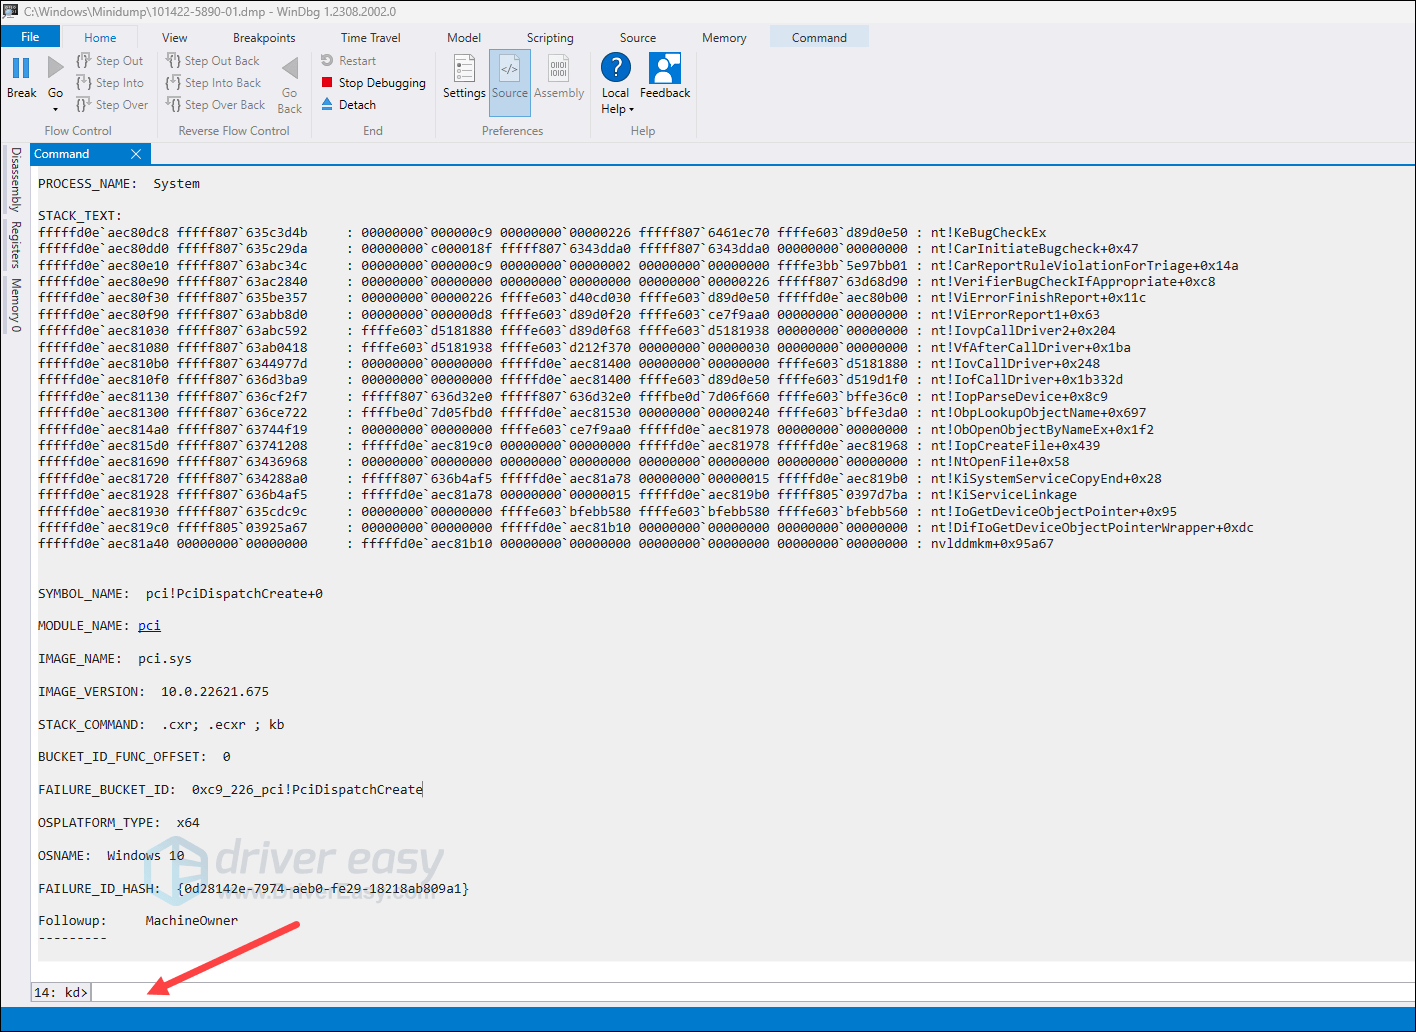
- Keep an eye on the MODULE_NAME and the IMAGE_NAME entries, as these are closely related to the faulting services or programs that cause the blue screen problems.
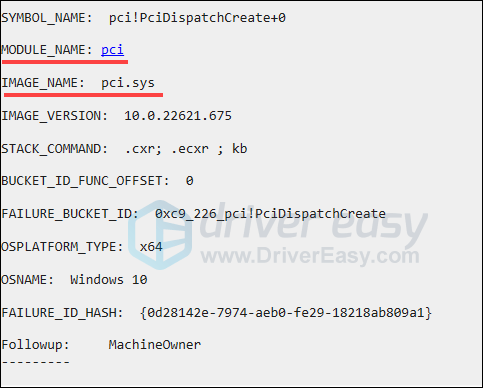
- On your keyboard, press the Ctrl key and the Home key at the same time to go to the top of the WinDbg window, and you’ll see more information there. Copy the first line of the crash log and run a Google search, and you’ll find more helpful results online.
- Or you can search the crash log you see here in our knowledgebase: https://www.drivereasy.com/kbc/blue-screen-error/ and see if there are targeted results.
- Another helpful source is Microsoft’s Bug Check Code Reference, but it’s a bit challenging if you’re not very experienced with computer crashes and fixes.